By the Numbers
By the Numbers: More Recycling, Lower Rate — The 2024 UK Waste Puzzle
Defra reports more household waste recycled in 2024, yet a lower recycling rate. Rebuild both percentages and see why the denominator matters.

The UK's latest household-waste figures contain a useful statistical puzzle. In 2024, more waste from households was recycled than in 2023, yet the published recycling rate edged down. The difference comes from the denominator: the total amount of waste grew faster than the recycled amount. This guide rebuilds the figures from Defra's September 2026 UK waste release using the Calcul8 Percentage Calculator.
The story number
Defra's 23 September 2026 update reports UK waste from households for 2023 and 2024. Its table gives these quantities in thousand tonnes:
| Year | Total waste arising | Recycled | Published recycling rate |
|---|---|---|---|
| 2023 | 25,913 | 11,558 | 44.6% |
| 2024 | 26,154 | 11,650 | 44.5% |
“Waste arising” is the total in this particular statistical measure. “Recycled” is a part of that total. The rate is recycled waste divided by all waste arising, multiplied by 100. The source year's figures are from 2023 and 2024; 2026 is the release year, not a claim about 2026 household waste.
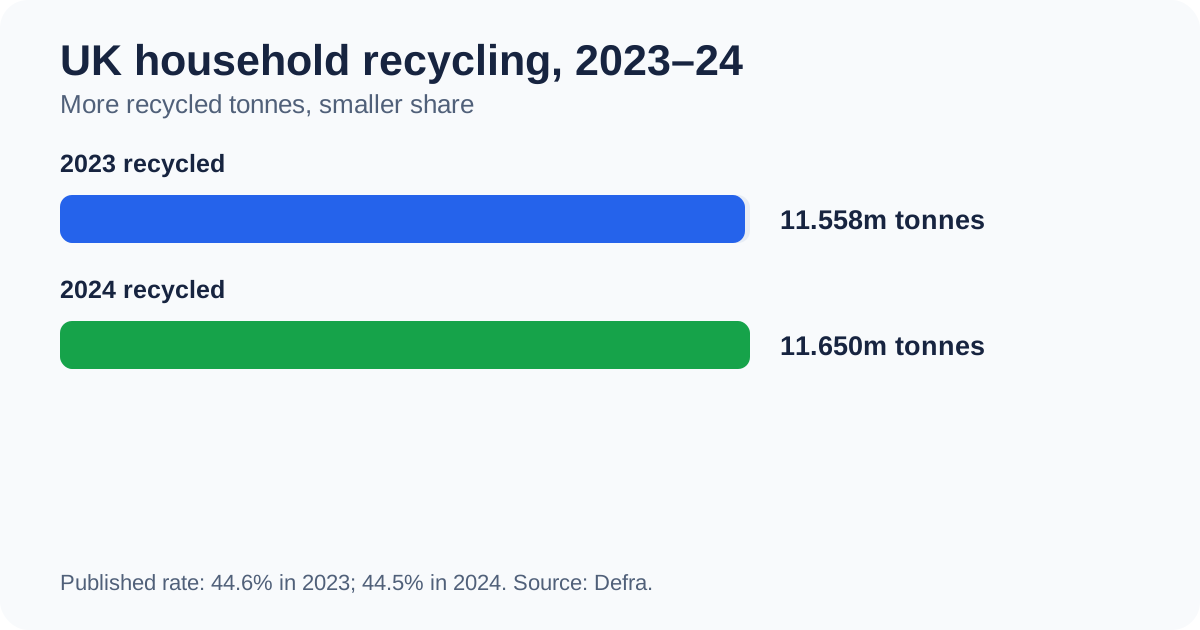
Chart note: These are national totals. The visual uses Defra's rounded table numbers; it does not depict an individual household or a council collection scheme.
Rebuild the percentage
The Percentage Calculator has a mode labelled “X is what % of Y?”. Here, X is the recycled amount and Y is the whole amount. Enter 11,558 as the first value and 25,913 as the second. The rounded figures produce about 44.60% for 2023. Change them to 11,650 and 26,154: the result is about 44.54% for 2024.
Defra publishes 44.6% and 44.5% because it calculates the official rates from figures with more precision than the displayed table. Do not “correct” Defra's rate using two rounded cells. The article's practical conclusion is unchanged: the proportion was a little lower even though the recycled quantity was higher.
The unit “thousand tonnes” cancels in the fraction. You could enter the numbers as 11.558 million and 25.913 million instead, provided both numerator and denominator use the same unit. Entering one in tonnes and the other in thousand tonnes would produce a meaningless percentage.
Why the two trends point in different directions
Use the Standard Calculator for the changes in quantities:
- Recycled: 11,650 − 11,558 = 92 thousand tonnes more (92,000 tonnes).
- Total waste: 26,154 − 25,913 = 241 thousand tonnes more (241,000 tonnes).
- Waste outside the recycled count: 25,913 − 11,558 = 14,355 thousand tonnes in 2023; 26,154 − 11,650 = 14,504 thousand tonnes in 2024.
The last line is simply the remainder of Defra's measure; it does not identify a particular disposal route. Its increase is 149 thousand tonnes, equal to 241 minus 92.
The Percentage Calculator can also compare growth rates. In “percentage change from X to Y” mode, enter 11,558 then 11,650: recycled quantity rose about 0.80%. Enter 25,913 then 26,154: the total rose about 0.93%. When the whole grows more quickly than one part, that part's share can fall. More recycled material and a lower recycling rate can therefore both be true.
Percentage points are different from percentage change
The published rate changed from 44.6% to 44.5%. The direct difference is 0.1 percentage points, downward. That is how Defra describes it. A relative percentage change would divide the rate difference by the older rate, answering a different question. Neither wording should be substituted for the other.
A simple toy example makes the denominator effect easier to see. Suppose a group recycled 45 out of 100 units. Its rate is 45%. Next year, it recycles 46 units, but the total rises to 104. Now the rate is 46 ÷ 104, or about 44.23%. Recycling increased by one unit; the share fell because the total rose by four. The toy numbers are invented to explain the mechanism, not estimates of UK waste.
What this figure can and cannot tell you
The UK measure combines countries with different collection arrangements and outcomes. Defra's same release lists 2024 household-waste recycling rates of 43.8% in England, 50.1% in Northern Ireland, 42.7% in Scotland and 58.6% in Wales. Do not treat the UK rate as the rate in every country or local area. The table's figures may also not add exactly because they are rounded.
The measure includes metal recovered and recycled after incineration. Defra says the accounting method raises the overall UK 2024 recycling rate by about 0.9 percentage points, equivalent to approximately 250,000 tonnes. That is a methodological inclusion, not a claim that every household sent extra metal for collection. Defra also revised some 2023 figures. For a close year-on-year comparison, use the latest release for both years instead of mixing in figures copied from an older article.
A higher recycling rate is not, by itself, a full description of waste prevention, reuse, material quality or environmental impact. This example is about reading the published fraction accurately. For the detailed definitions and coverage, read Defra's methods and table notes.
Try your own numbers
Use the Percentage Calculator with a numerator and denominator from the same place, year, unit and definition. If you want to compare two years, run “X is what % of Y?” once for each. Then use “percentage change” on the underlying amounts to see which grew faster. The Standard Calculator can show the difference in units as well as a percentage.
For another example of why a headline percentage needs a clearly stated baseline, see How to Calculate Percentage Increase. These tools explain arithmetic; they cannot determine which materials your local authority accepts or replace local recycling guidance.
Sources and image note
- Defra, UK statistics on waste (updated 23 September 2026): Table 1, key points, revisions and method notes. Accessed 29 September 2026.
- The header image is an original editorial illustration of household materials. The in-article graphic was created for Calcul8 from the rounded Defra table values; neither is a photo or chart supplied by Defra.