By the Numbers
By the Numbers: Hurricane Polo’s 90-Knot Rise Explained
A 90-knot rise in 24 hours was 150% of a 60-knot extreme-intensification threshold. See why that is not the storm’s percentage wind-speed increase.

On 22 September 2026, the US National Hurricane Center reported that Hurricane Polo had strengthened by about 90 knots in 24 hours. NASA Earth Observatory's account compares that change with an at-least-60-knot threshold for extreme rapid intensification. Those two figures are easy to confuse with the storm's actual wind speed. This explainer uses the Calcul8 Percentage Calculator to separate an increase, a threshold, and an ending speed.
The reported change and its source
The National Hurricane Center's discussion issued at 3:00 a.m. Central Standard Time on 22 September estimated Polo's maximum sustained winds at 130 knots at that advisory time and described an increase of about 90 knots over the previous 24 hours. NASA's article, published 25 September, recounts the intensification and explains the 60-knot-in-24-hours extreme threshold. We use the dated advisory for the observation and NASA for the threshold and surrounding scientific context.
A knot is one nautical mile per hour. Wind speeds stated in knots, miles per hour and kilometres per hour may look very different while describing the same speed. NASA rounds the 90-knot increase to approximately 167 km/h or 104 mph. These conversions describe the size of the speed increase, not a separate measured wind speed or a safe travel speed.
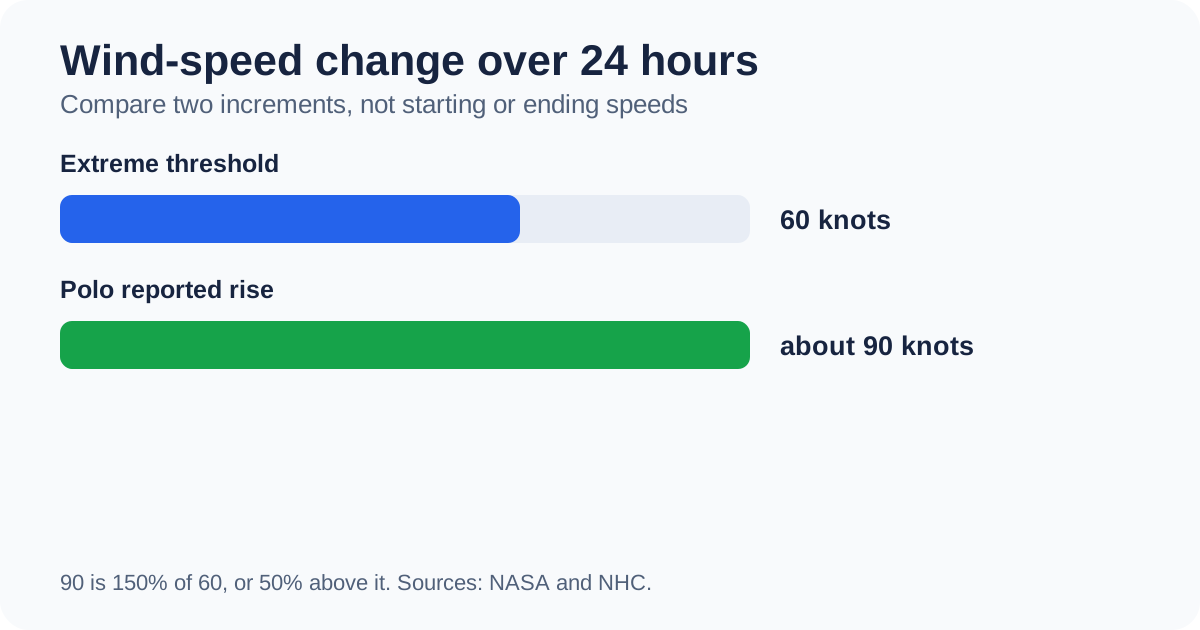
Chart note: Both bars are changes over 24 hours. Neither bar is Polo's wind speed at the start or end of that day.
Run the percentage comparison
Open the Percentage Calculator and choose “X is what % of Y?”. Enter 90 as X and 60 as Y. The result is 150%. In words, the reported 90-knot rise is one and a half times the comparison threshold.
There is a second, equally valid way to phrase the same relationship: 50% above the threshold. Choose “percentage change from X to Y”, with 60 as the first value and 90 as the second. The calculator shows 50%. You can check that with the Standard Calculator: (90 − 60) ÷ 60 × 100 = 50.
The two percentages are not contradictory:
- 150% of describes the full 90-knot increase compared with 60 knots.
- 50% above describes only the extra 30 knots compared with 60 knots.
The denominator in both cases is the threshold, not the storm's earlier wind speed. Saying “Polo's winds increased by 150%” would therefore be unsupported by this calculation. To calculate a percentage increase in wind speed, you would need a clearly paired starting and ending speed at the relevant times, with compatible measurement methods.
Why dividing by 24 needs care
The Standard Calculator gives 90 ÷ 24 = 3.75 knots per hour. That is an interval average of the reported change, useful for understanding scale. It is not a record of 3.75 knots added in each individual hour. Tropical cyclone intensity does not have to rise at a constant pace. NASA describes a complex setting involving sea temperature, atmospheric moisture, wind shear and ocean heat; the arithmetic alone does not identify a cause.
Likewise, the NHC's 130-knot estimate at the advisory and its approximately 90-knot prior-day rise might tempt a reader to subtract and announce an exact 40-knot starting measurement. Both are estimates, and the release's “about” matters. A rigorous time-series comparison should use the dated sequence of advisories and its observation methods, not one subtraction from a rounded summary.
What the sea-temperature numbers mean
NASA reports sea surface temperatures as high as 32°C in parts of Polo's path, around 2–3°C warmer than usual for 23 September in the reference dataset used for its map. The 32°C is an absolute temperature; the 2–3°C is a difference from a reference average. They should not be interchanged. An anomaly map is a comparison against a defined baseline, not a weather forecast. Ocean warmth is one part of the environment; NASA's experts cautioned against assigning this single event to one climate pattern without considering the other conditions.
For a wider discussion of temperatures and units, try the Unit Converter. It is important to distinguish converting an absolute Celsius temperature from converting a Celsius difference: the conversion factor applies to both, but the Fahrenheit offset applies only to absolute temperatures.
Watch the official explainer
The NOAA/NWS National Hurricane Center video “Rapid Intensification” explains the broader process. It is an educational companion, not the source for this article's Polo measurements or the 60-knot extreme threshold. The figures above come from the dated NHC advisory and NASA article.
Try the comparison yourself
On the Percentage Calculator, replace 90 with another 24-hour increase in knots while leaving 60 as the threshold. In “X is what % of Y?” mode, you will see how large the increase is as a fraction of the threshold. In “percentage change” mode, you will see how far above or below it is. Keep the same units and time interval for both inputs. If your question is about the storm's actual wind speed change, use paired official wind estimates instead.
This page is about interpreting a published number. It does not provide live storm tracking, hazard assessment or travel guidance. For current conditions and warnings, use the National Hurricane Center and the relevant local authority.
Sources and image note
- NHC, Hurricane Polo Discussion Number 7, 22 September 2026: estimated wind speed and approximate 24-hour change.
- NASA Earth Observatory, Explosive Intensification for Hurricane Polo, 25 September 2026: threshold, conversions and scientific context. Both pages accessed 29 September 2026.
- NOAA/NWS National Hurricane Center, Rapid Intensification video, published 15 August 2025. The header image is an original conceptual illustration, not satellite data from Polo. The in-article chart uses the sourced 60- and 90-knot figures.